
What if Saylor is liquidated?
How low will BTC go if Saylor dumps his entire 500,000 BTC stash today? This analysis is a work of fiction — presented to you by ChatGPT.


What if Saylor pulls the plug?
We all know that Saylor would rather sell his house and kidneys instead of selling his bitcoins. To date, his firm MicroStrategy owns a whopping 506,137 bitcoins (worth ~$42 billion at the time of writing) — approximately ~2.5% of the total BTC supply!
But what if, in an alternate universe, Saylor decides to liquidate MicroStrategy’s entire BTC stash? Pulling the rug or rugging the pull — something like that.
In this article, we examine the price impact to Bitcoin’s current market price (~$84,000 at the time of writing) assuming a full dumping of MicroStrategy’s entire BTC reserves under a Time-Weighted Average Price (TWAP) execution strategy over two timeframes (1 month vs. 3 months) and in two scenarios:
Ceteris Paribus, where all other market conditions remain constant. Only MicroStrategy’s sell pressure is impacting price, while other participants continue normal trading behavior (no panic withdrawals of liquidity or front-running). This provides a baseline of “direct” price impact from the added supply.
Market Reaction, where MicroStrategy’s selling triggers broader market volatility, panic selling, and cascading liquidations. This could include: other holders panic selling, speculators shorting BTC, market makers widening spreads or pulling bids (reducing order book depth), and leveraged long positions being liquidated as price drops (forced sell orders cascading). These reactions amplify the price impact beyond MicroStrategy’s own sales.
All major liquidity sources are considered – on-chain liquidity, off-chain centralized exchange (CEX) order books, and OTC desk activity – to estimate how the market might absorb such an unprecedented sell order.
Forecast assumptions
Current Market Conditions: BTC is trading around $84,000 (mid-$80k range) at the time of writing. The 24-hour trading volume is on the order of ~$25–$30 billion (roughly 300k–350k BTC turnover per day), indicating relatively high liquidity in nominal terms. We assume these conditions as a starting point.
MicroStrategy Holdings: Total BTC to be sold = 500,000 BTC. (This is ~2.5% of total circulating BTC supply and about 10% of the estimated liquid supply, since roughly 75% of BTC is “illiquid” in long-term holdings. We assume MicroStrategy executes via a TWAP algorithm, evenly distributing sales over time (either ~16,700 BTC/day for 30 days, or ~5,600 BTC/day for 90 days).
Liquidity Sources: We account for: (a) On-chain liquidity – e.g. decentralized exchanges or direct peer-to-peer trades facilitated on-chain (limited relative to CEX volume), (b) Off-chain liquidity – primarily CEX order books where most BTC trading occurs, and (c) OTC desks – which can broker large blocks privately to minimize visible order book impact. We assume MicroStrategy would utilize OTC for part of the sales (finding large buyers off exchange), but ultimately much of the volume still affects market supply/demand (OTC buyers might otherwise have bought on exchanges, and OTC desks may hedge large buys by selling futures or spot).
Metrics Tracked: We analyze slippage (how far price drifts below $84k as sales execute), order book absorption (how much existing buy orders absorb the supply vs. how much price must fall to entice new buyers), and illiquid vs. liquid supply dynamics (unlocking a large stash of long-term held coins into circulating supply). We use historical analogues and on-chain data where available to inform these estimates.
Bitcoin’s liquidity profile
Illiquid vs. Liquid Supply: An estimated 14.8 million BTC (≈75% of circulating supply) is held by illiquid long-term holders, meaning only ~25% (≈5 million BTC) is in more liquid circulation. Exchange reserves are near multi-year lows at just ~3 million BTC on exchanges. MicroStrategy’s 500k BTC is ~10% of the liquid supply and ~17% of all exchange-held BTC, a massive influx if those coins hit the market. Such a supply shock would likely require a notable price discount to attract sufficient buyers.
Order Book Depth: Market depth measures how much BTC can be sold at or near the current price before the price moves significantly. For instance, one report noted only ~$384 million of BTC ask liquidity between the then-current price and $100k (just ~3,840 BTC) on exchanges. This illustrates that on any given day, order books may only have a few thousand BTC of resting buy orders within a few percent of the price. 500k BTC vastly exceeds typical depth, meaning MicroStrategy’s sales would continually eat into lower bid levels. Even with TWAP execution, the accumulated slippage would be significant as the algorithm persistently drains buy orders faster than they replenish.
OTC and Off-Exchange Liquidity: OTC trading can facilitate large transfers without immediate order book impact. MicroStrategy might offload portions via OTC deals to institutions or high-net-worth buyers. OTC trades, however, don’t magically remove market impact — they just transfer the BTC off exchange; the buyers’ funds that would have driven up price on exchanges are instead spent OTC. Moreover, OTC desks often hedge their risk in real-time by selling futures or other instruments, inevitably putting downward pressure on the public market. Thus, while OTC usage could smooth out some turbulence, the net effect of 500k BTC exiting long-term storage is a huge increase in available supply that the market must absorb one way or another.
Baseline Demand: At ~$84k per BTC, a daily volume of ~300k BTC (all sides) implies many buyers are transacting at these levels. In a steady state (no news), price is balanced by roughly equal buy and sell flow. Introducing an extra 16.7k BTC of sell pressure per day (~5% of typical daily volume) will disturb this balance. Under normal conditions, we’d expect price to gradually decline until new buyers step in to absorb the excess (or until sellers withdraw).
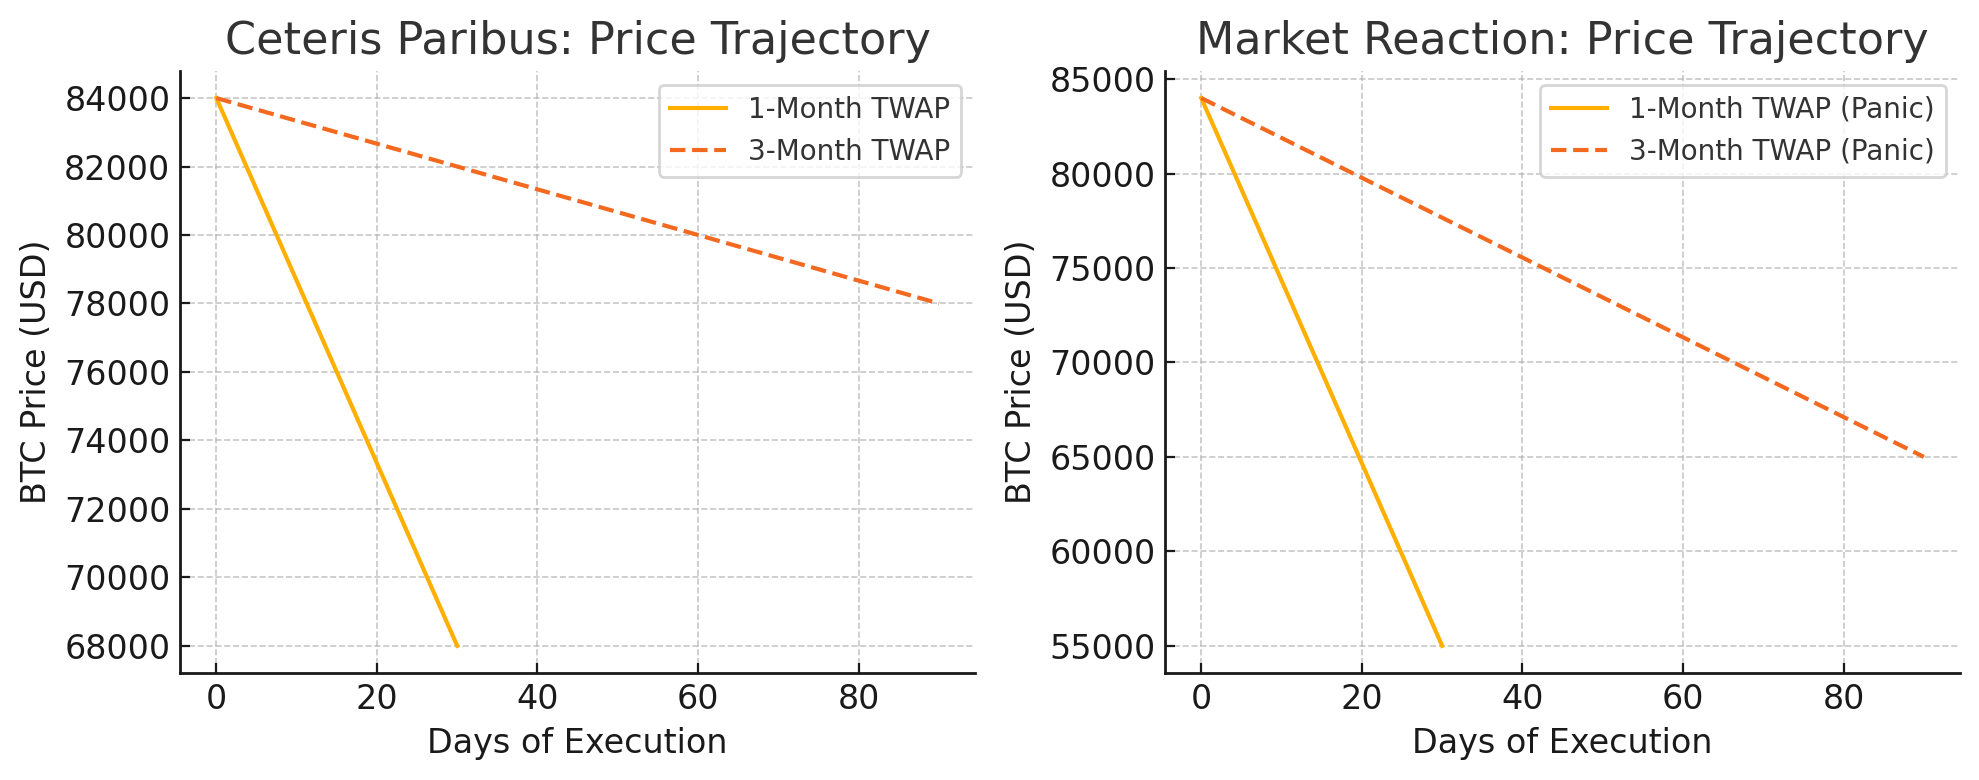
Scenario 1: 1-month TWAP execution
MicroStrategy sells ~16,700 BTC per day for 30 days (approximately $1.4 billion USD worth daily). This is an aggressive pace, representing a sizeable chunk of daily market volume. We examine two outcomes:
1-month ceteris paribus (no market reaction)
Under the assumption that other market participants do not panic or change behavior drastically, the price impact is driven primarily by order book absorption and slippage from MicroStrategy’s continuous sells:
Gradual Price Decline: With ~5% extra sell volume each day, we’d expect a steady downward trend in price as the TWAP algorithm continually feeds coins into the market. Buyers would likely demand a discount to absorb this supply. A rough estimate using transaction cost analysis analogies suggests a sale equal to ~2.5% of BTC’s supply might cause a double-digit percentage drop in price in total. Indeed, an analysis by NYDIG found that selling 1.9% of an asset’s supply in a block trade could move the price by ~2.8% (best case) up to ~11.2% (worst case) in traditional markets. Bitcoin’s illiquid nature saw even larger moves on just the threat of such sales (17% drop on Mt. Gox/US government sale fears).
Order Book Absorption: Each day’s 16.7k BTC would be absorbed by a combination of existing buy orders and new buyers attracted by slightly lower prices. Early in the sell program, the impact per hour might be small (as liquidity is initially available), but as days progress, the constant depletion of bids would cumulatively drive the market down. Market makers would adjust to the persistent sell pressure by lowering their bid prices. In effect, MicroStrategy’s coins would fill much of the available buy liquidity at each price level, then “walk” the price down to find more liquidity.
Final Price Range: By Day 30, BTC might settle in the mid to high-$60,000s under this baseline scenario (roughly 20% below the starting price). We present this as a range (e.g. ~$65k–$70k) to account for uncertainty.
The market needs a materially lower price to entice enough fresh demand to absorb 500k BTC in one month. Notably, such a decline might attract value buyers (e.g. other institutions or long-term bulls stepping in), which could help form a bottom once MicroStrategy’s selling is nearing completion.
If overall sentiment remains bullish (apart from the MicroStrategy event), those buyers could somewhat cushion the fall. In fact, historical data shows that during periods of large whale distribution (e.g. ~290k BTC sold by whales over 5 months recently), other entities did absorb the supply, allowing the price to stabilize around mid-$80k. In our 1-month case, the distribution is far more concentrated, so a noticeable dip is more likely before equilibrium returns.
1-month market reaction (panic & volatility)
If the market perceives or anticipates MicroStrategy’s massive sell program, psychology and leverage dynamics could greatly amplify the price impact:
Panic Selling & Front-Running: Upon rumor or confirmation that a major holder is liquidating, other investors might rush to sell before “Saylor’s coins” hit the market. This front-running effect adds additional non-MicroStrategy sell volume. Long-term holders who fear a price collapse might move coins to exchanges (increasing on-exchange supply) and sell, and short-term speculators might pile on shorts. The order books, expecting heavy supply, could thin out as buyers pull bids, causing even minor market sells to hit lower price levels. Essentially, the market’s bid side liquidity could evaporate in anticipation of ongoing sales. Empirical evidence of such behavior can be seen when negative news sparks volatility – for example, during a sudden sell-off in August 2024, slippage on BTC-USD tripled within hours as order books struggled to fill orders at expected prices. In our scenario, this means MicroStrategy’s each chunk sale would start to incur widening slippage as the month progresses and fear sets in.
A rapidly dropping price can trigger cascading liquidations. Many traders use leverage; if BTC falls say 15–20% quickly, leveraged long positions might start liquidating (exchanges automatically selling their BTC to cover margins). Those forced sales drive the price down further, liquidating more positions in a vicious cycle. Such cascading liquidations have been observed in past crypto crashes, where a large initial drop snowballs into a much deeper crash as one liquidation triggers another. In this panic scenario, MicroStrategy’s steady selling could catalyze a sharper one-time drop at some point during the month if a cascade is unleashed. For example, BTC could briefly plunge well below fundamental levels – perhaps breaking $60k, $50k, or even lower – not solely due to the 500k BTC being sold, but due to this cascade effect and general capitulation.
Volatility and Overshoot: Markets often overshoot in such panic. It’s plausible that midway through the month, BTC finds a temporary bottom far below the “fair” price needed to absorb 500k BTC. For instance, BTC might plunge to ~$45k–$55k at the peak of panic (a 35–45% drop), if fear and liquidations run rampant. This would reflect a moment when supply completely overwhelms demand and nobody wants to catch the falling knife. However, at dramatically lower prices, bargain hunters (and perhaps OTC buyers) would step in aggressively. If MicroStrategy continues TWAP selling through this, their remaining sales would execute at much lower prices, but those same low prices might also entice new demand to stabilize the market.
Orderly Completion vs. Intervention: In this scenario, there’s also the question of whether MicroStrategy (or its brokers) might pause or slow the selling if the market gets disorderly. A well-managed TWAP might actually throttle down if slippage gets too high. But assuming they must sell 500k within the month, they might plow through regardless. By the end of the month, once the overhang is gone, the market could rebound from the overshoot low. We might see BTC end the month somewhat higher than the panic bottom, but still significantly below $84k. For example, after hitting ~$50k at peak fear, BTC could recover to ~$55k–$60k by day 30 as selling pressure abates (still ~30–35% down monthly).
Final Price Range: We estimate a potential ~$50k–$60k range by the end of the 1-month panic scenario, with intra-month lows that could be lower if a severe cascade occurred. In other words, a short-term crash followed by partial recovery as the market finds equilibrium post-MicroStrategy. The final price drop might be on the order of 30–40% from the starting point. This aligns with historical analogues of extreme events (for instance, past Bitcoin drawdowns of 30–50% in a matter of weeks during capitulation events).
The presence of large buyers on standby (e.g. other institutions or nation-states) could limit the damage if they view the dip as an opportunity. Additionally, if MicroStrategy’s intent to sell became public, one might even see coordinated market responses (e.g. exchanges preparing liquidity, OTC desks matching buyers) to prevent complete chaos. Nonetheless, heightened volatility would be expected throughout the month.
In summary, the 1-month execution scenarios highlight that even in the best case (no extra panic), a substantial price decline is likely. In a worst-case psychological reaction, BTC’s price could temporarily be slashed nearly in half, before stabilizing once the sell program completes.
Scenario 2: 3-month TWAP execution
In this scenario, MicroStrategy stretches the selling over a quarter, unloading ~5,556 BTC per day for 90 days. This slower pace is about one-third of the daily pressure of the 1-month scenario, giving the market more time to absorb coins. We again consider both a calm scenario and a reactive scenario:
3-month ceteris paribus (no market reaction)
With a more gradual sale, the market impact is significantly moderated:
Slower, Milder Decline: Selling ~1.5% of daily volume each day (instead of 5%) is much easier for the market to digest. Price would still trend downward over time, but likely at a gentler slope. Buyers and arbitrageurs have time to adjust positions, and other sources of demand (e.g. monthly dollar-cost-averaging flows, institutional buy programs, etc.) can counteract some of the sell pressure.
Over 90 days, on-chain and off-chain participants can mobilize liquidity more effectively. OTC desks could quietly match a larger portion of the 500k to buyers over time, reducing the load hitting exchanges each day. The market might not even be certain the selling is happening – a 5.6k BTC/day sell could potentially hide within normal variance of daily flows, especially if split across venues. For instance, if MicroStrategy works with multiple exchanges and desks, that ~5.6k could be, say, 500 BTC per exchange per day, which might not stand out strongly.
Order Book Dynamics: With lighter daily sales, order books have time to refill. After each small TWAP sell tranche, buyers can step back in, and market makers adjust gradually. Slippage per trade remains low. MicroStrategy’s algorithm might be able to execute closer to the prevailing market price each time, resulting in a higher overall average sell price than in the 1-month case.
Final Price Range: Under calm conditions, BTC might end around the mid-$70,000s after 3 months, down perhaps 10–15% from $84k. In a more optimistic case (if new bull market participants absorb the coins), the price might even stay near $80k, essentially moving sideways with high volume throughout the quarter. In a slightly more pessimistic case, perhaps it dips toward ~$70k (≈20% drawdown) at some point if demand lags. Overall, the longer timeframe dramatically reduces peak slippage and allows the market to better digest the supply incrementally.
3-month market reaction (extended unease)
Even with a slower sell rate, the market could react if it becomes known that a major holder is distributing coins. The character of the reaction might differ from the 1-month panic: rather than a single sharp crash, we could see a prolonged period of elevated volatility and a grinding downtrend:
Sentiment Overhang: Knowing that 500k BTC will be sold over the next 90 days could create a persistent bearish sentiment. Traders might be less willing to bid prices up during rallies (“there’s a whale selling every uptick”). This can lead to a series of lower highs and lower lows over the months. Unlike the sudden shock of a 1-month fire sale, a 3-month sale might not trigger immediate panic selling, but it can induce a slow capitulation – people gradually lose confidence that price can rise in the near term, so they start selling rallies or reallocating to other assets.
Volatility Episodes: Although a straight-line crash is less likely, we may still see pockets of volatility. For instance, at the start, when rumors first hit, BTC could drop 10–15% quickly (say from $84,000 to mid-$70,000s) as an initial reaction. After that, the market might stabilize for a while in the low $70,000s as the reality of ongoing selling is “priced in.” Throughout the 3 months, any time BTC attempts to rally (e.g. on good news), it may be met with extra supply (both from MicroStrategy’s program and speculators selling, anticipating MicroStrategy will sell into the strength). This creates a choppy, range-bound market.
Lower Liquidity Environment: Over a long duration of perceived bearishness, some liquidity can actually leave the market – market makers widen spreads, volume can drop as trend traders step aside. This ironically can increase slippage at times. However, the flip side is that some buyers will also place bids much lower anticipating the drawn-out sales, which can eventually form support levels.
Cascade Risk Lower: The risk of a huge one-time cascade of liquidations is lower here, simply because the price path may be more stepwise and not a single precipitous drop. If leverage is gradually bled out of the market by a slow decline, we might not see the kind of abrupt margin cascade that a sudden drop would cause. That said, any additional negative news could still trigger a cascade from that weakened state — the system is not without risk.
Final Price Range: By the end of the 90 days, BTC could potentially be in the low-$60,000s under this reactive scenario. We estimate a range of roughly $60k–$70k as plausible. That would be a ~20–30% decline over three months – a significant drawdown but slower in realization. If the market remained risk-averse throughout, the final price might be closer to the lower end; if the selling became an “open secret,” the final weeks might actually see price rise once traders sense the end is near (buying in anticipation of the selling pressure stopping). For example, perhaps BTC dips to ~$60k at the worst point (maybe around month 2), then by the end of month 3 it recovers to ~$65k–$70k as supply-demand balance improves.
Overall, the 3-month scenarios (both calm and reactive) suggest less severe price impact than the 1-month scenarios, due to the more manageable pace of sales. The worst-case in three months is likely a drawn-out bear trend rather than an acute crash.
Result: it was surprisingly (not) that bad…

We’re all gonna make it?
In conclusion, if MicroStrategy were to liquidate its 500,000 BTC holdings via TWAP starting today, the Bitcoin market would likely face a notable downturn. In a best-case, orderly scenario (all else equal), Bitcoin might decline moderately (on the order of 15–20%) over the execution period, settling in the ~$70k range by completion. The selling pressure would manifest as a gradual headwind that the market could eventually absorb, especially given the depth of crypto markets in 2025 and the potential for new buyers to be attracted at slightly lower prices.
In a worst-case, reactive scenario, the impact could be far more severe in the short term — a cascade of fear and forced selling might drive BTC sharply lower (30% or more), with prices possibly dipping into the $50k range (or even briefly lower) before finding a bottom. All liquidity avenues – on-chain and off-chain – would be tested. On-chain metrics would likely record spikes in exchange inflows and coin movements, while off-chain venues (exchanges, OTC desks) would see heavy volumes and widening spreads during the sell-off. Slippage costs would mount, and order books would need to thicken at lower price levels to accommodate the influx of coins.

But all in all, I guess the one takeaway that we can get out of this fictional thought exercise, is that Bitcoin’s adoption rate in the current cycle has gone way beyond the levels of its previous cycle (2021). Even if we were to assume the highly unlikely scenario of MicroStrategy dumping its entire BTC stash, Bitcoin’s market capitalization would still not go far below its previous cycle’s peak (~$69,000).
In other words, bad news for bears and sidelinoorrrs — your mythical sub-$50k BTC entry that you’re hoping for definitely won’t be coming anytime soon!